Projects

Reports, code, maps, and presentations from coursework and research projects, spanning climate science, environmental management, water systems, GIS, and more.

Field Studies

Reports and presentations examining watershed hydrology, river systems under climate stress, and nature-based restoration strategies.

Fieldwork along the Big Hole River, Montana

Aquifer Characterization

Seismic refraction and resistivity surveys at Michigan’s Wyoming field station traced its unusually productive well, up to 150 gallons a minute, to a gravel layer feeding fractured bedrock below, recharged by a nearby mountain stream.

Working on a small field team at the University of Michigan’s research station in Wyoming, we used seismic refraction and electrical resistivity tomography to investigate why the camp’s well produces up to 150 gallons per minute, far more than neighboring wells. Our data, as well as geomorphic surveying in the area, pointed to a two-layer system with a permeable gravel layer feeding water down into fractured bedrock below, recharged by a nearby mountain stream. Our findings supported the case for the camp’s ongoing expansion project.

View Report (coming soon)
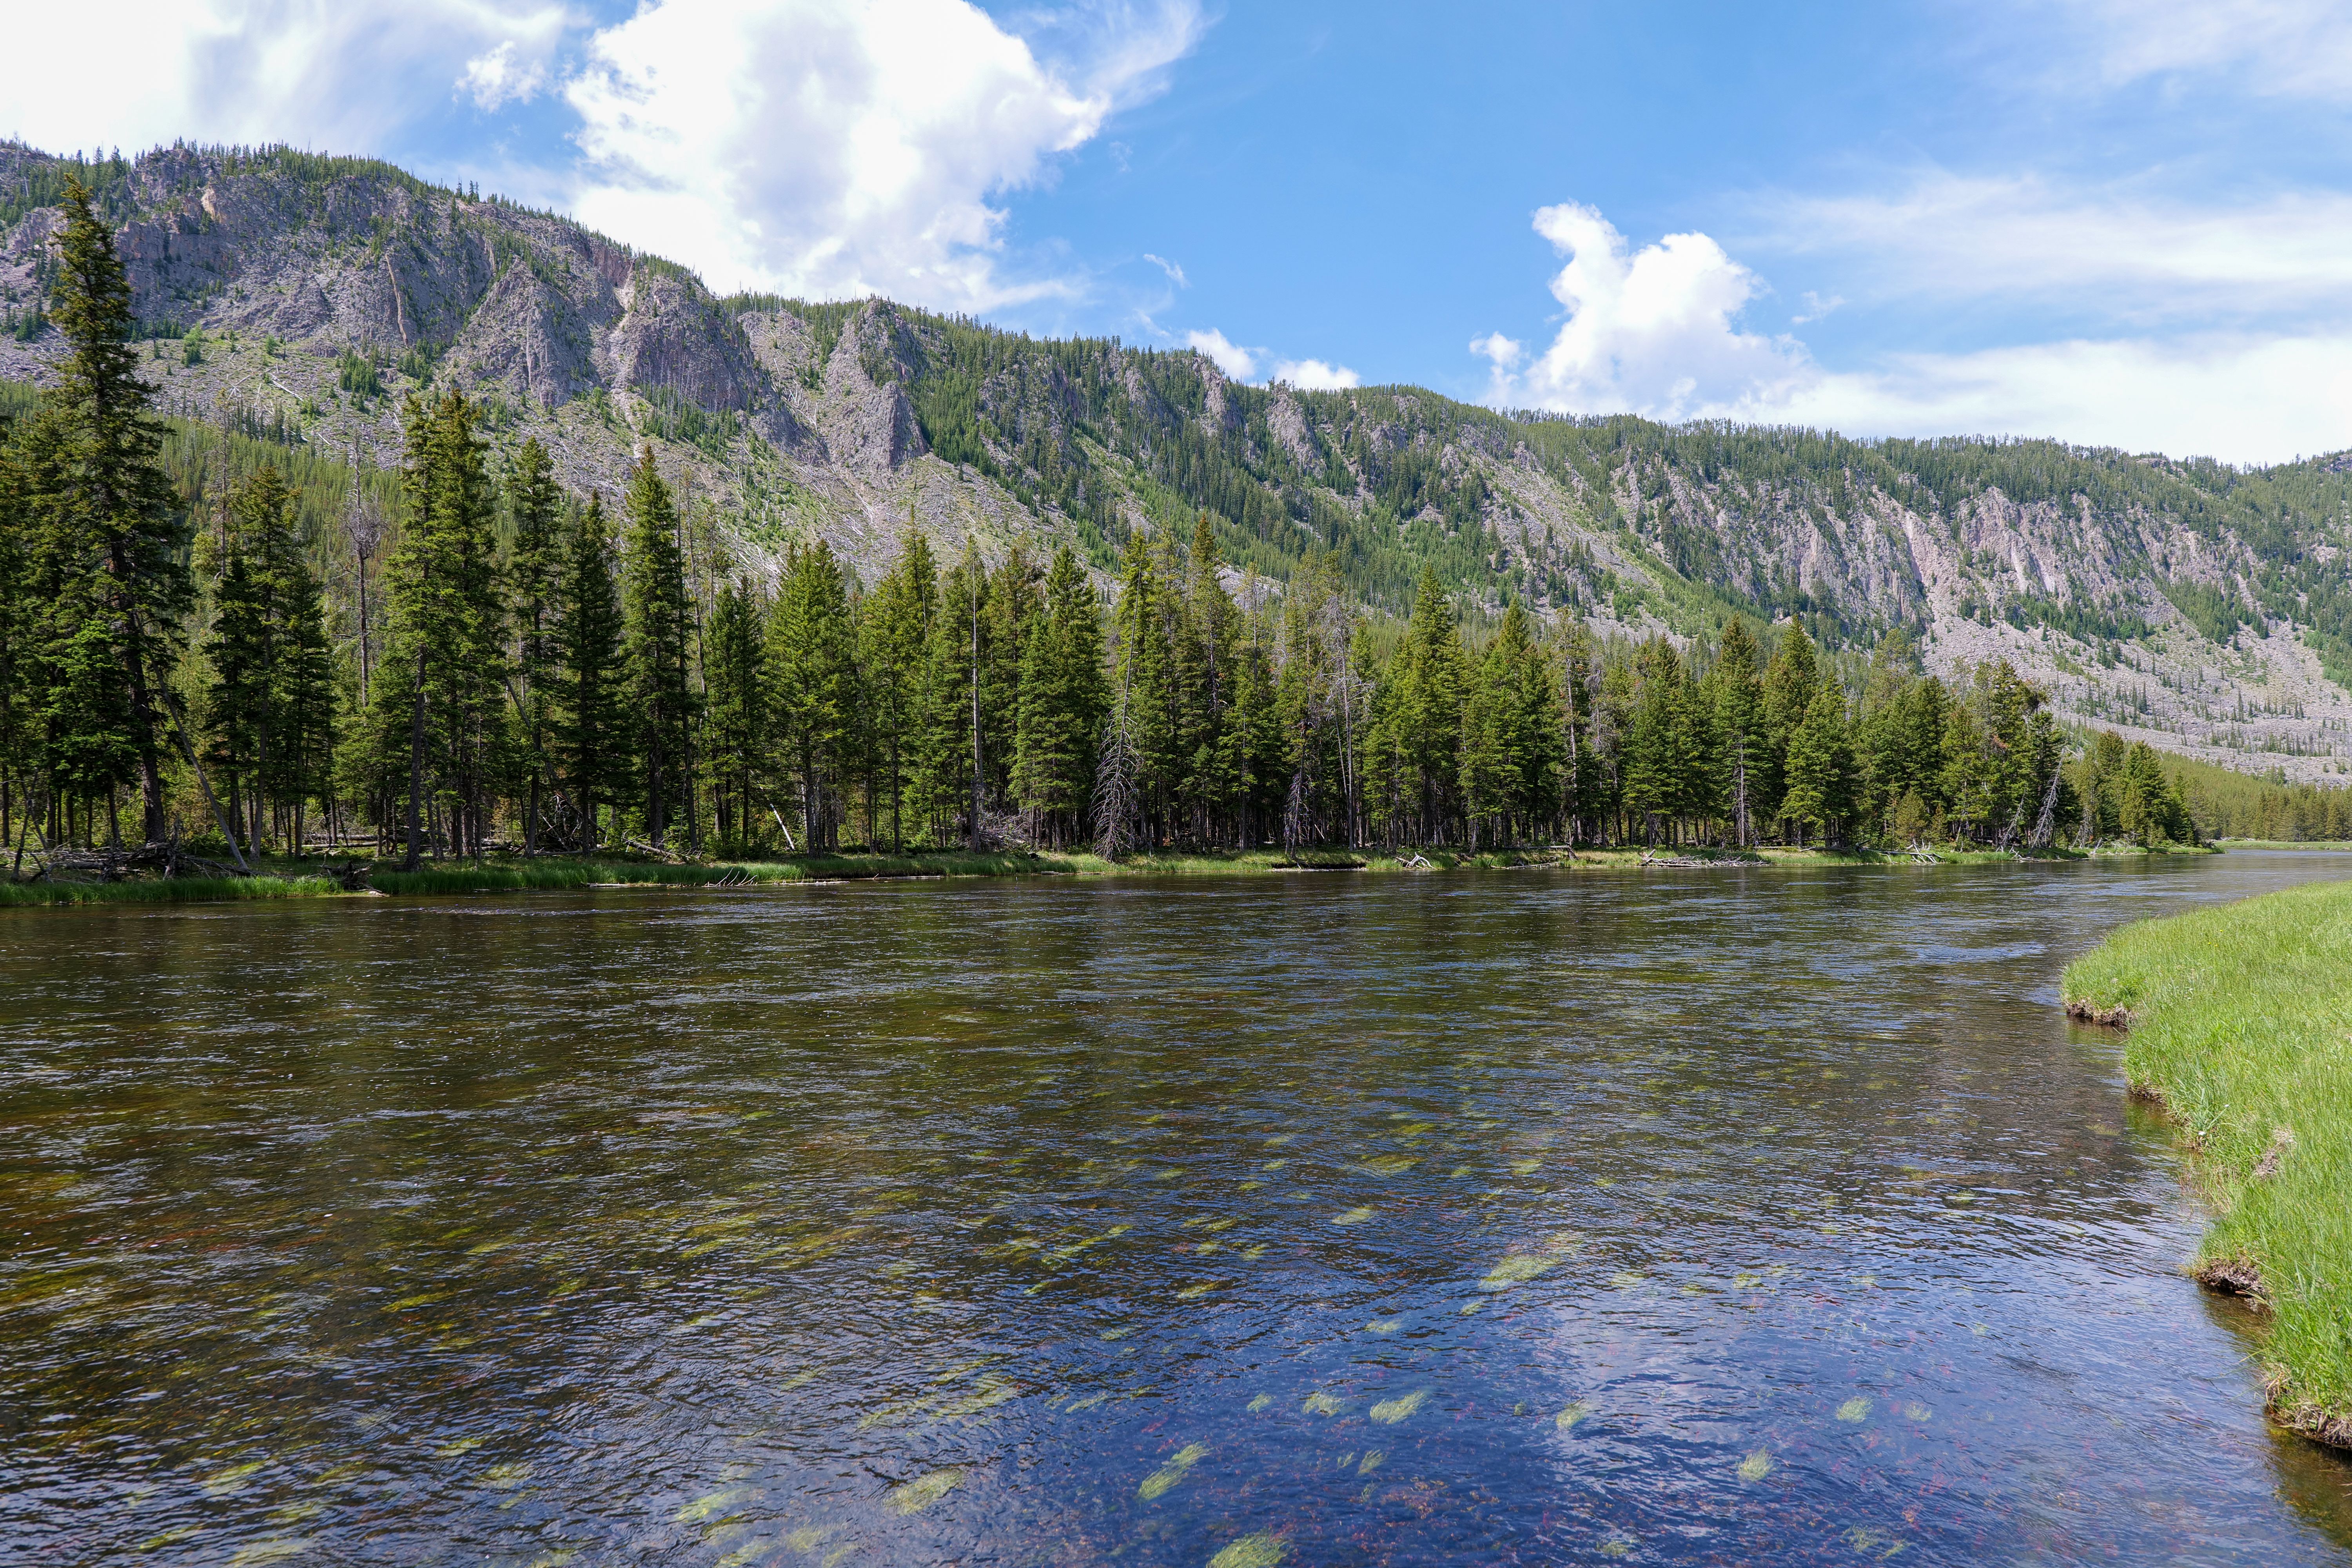
The Big Hole River running past conifer forest and mountains

Big Hole River Changes

Twenty years of Big Hole Watershed data show water temperatures climbing sharply while overall flow stays flat, squeezing the exact August window Arctic Grayling, ranchers, and irrigators all depend on.

Climate data from the Big Hole Watershed over the last twenty years has revealed that water temperatures are rising sharply while overall water quantity has stayed relatively flat. Working with seasonal data plots, a 2013 water temperature study, and local rancher Erik Kalsta, I examined how earlier snowmelt and hotter summers are adding stress to the exact August window Arctic Grayling depend on most. My findings support how that kind of stress puts ranchers, irrigators, and fish habitat in direct competition for the same water.
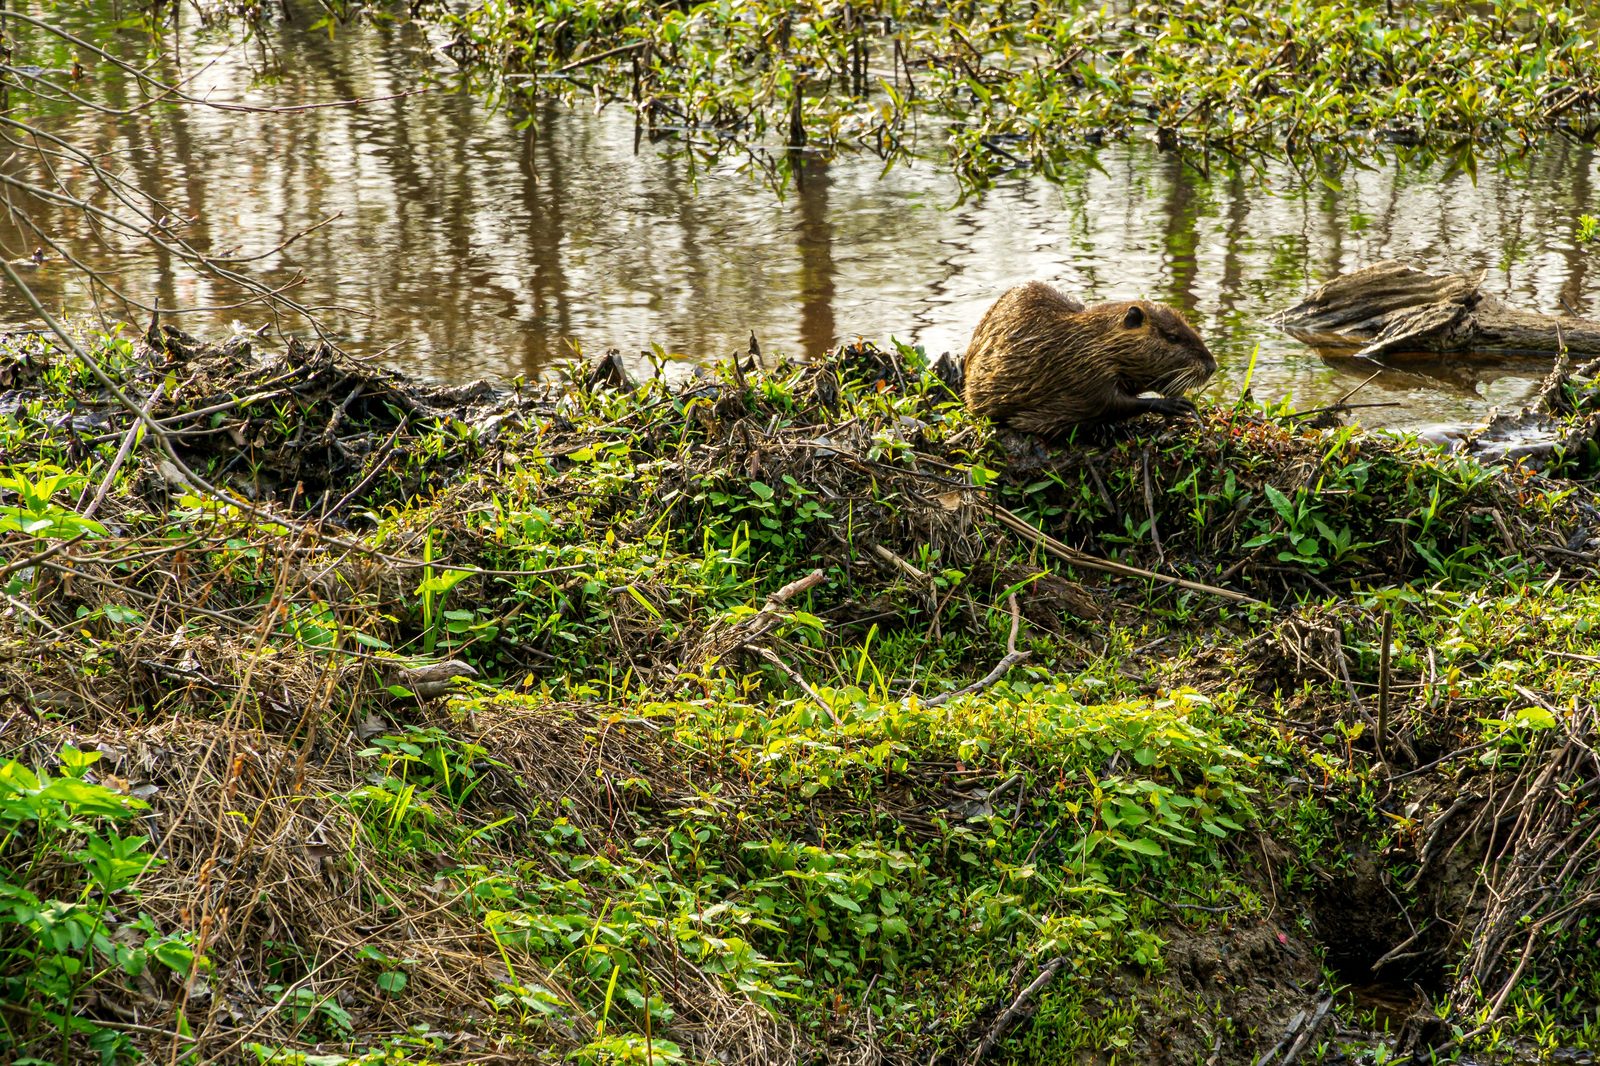
A beaver on a dam along a wetland stream

Beaver Dam Analogues (BDAs)

Birch Creek was the warmest stream we sampled, so our team proposed four beaver dam analogues there to help slow the water down and send it back into the river colder later in the summer.

For this project, our team pitched a plan to build four beaver dam analogs on Birch Creek, a Big Hole River tributary that turned out to be the warmest stream we sampled and feeds into the river’s most drought-stressed sections. Beavers used to keep this kind of wetland habitat healthy before the fur trade and mining wiped most of them out, so the BDAs are meant to do the same job: slow the water down, let it soak into the ground, and send it back into the river colder later in the summer. We pitched it as a funding proposal from a conservation angle, showing how a low-cost pilot on Birch Creek could help ranchers, anglers, and Arctic Grayling downstream.

View Proposal

GIS

Geospatial analysis of environmental risk.

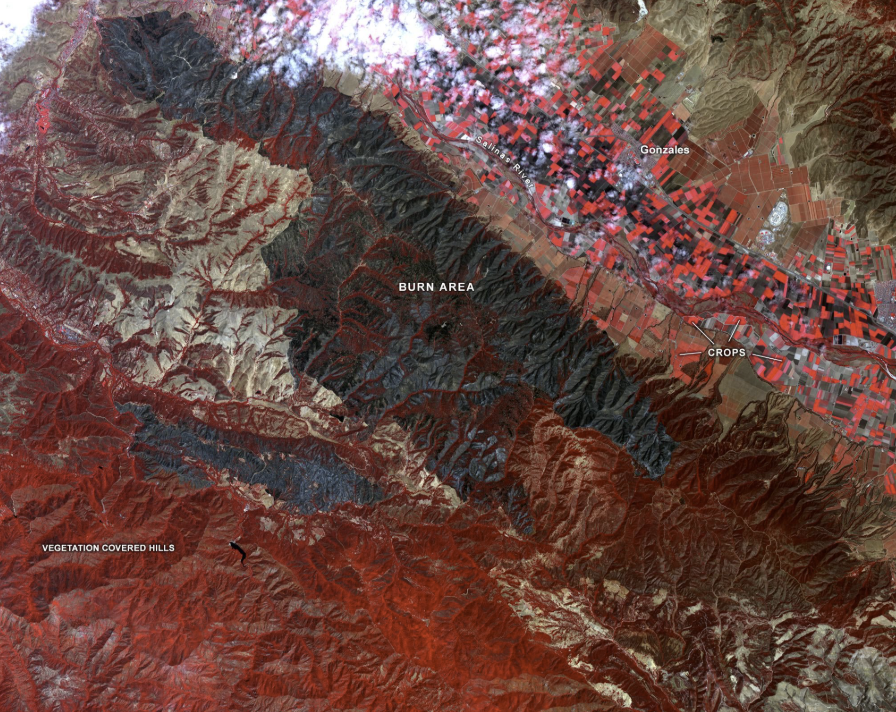
False-colour satellite imagery showing a burn area beside vegetated hills

Forest Fires in Yellowknife

Comparing Landsat 9 imagery from before and after the 2023 Yellowknife wildfires in ArcGIS Pro, zonal statistics showed reflectance variability jump from about 500 to over 4,500.

For this project, I used ArcGIS Pro to analyze the 2023 Northwest Territories wildfires near Yellowknife, comparing Landsat 9 imagery from before and after the fires alongside a 30-meter DEM hillshade of the area. I ran zonal statistics on both scenes to put real numbers behind what the imagery was already showing, and the standard deviation in reflectance jumped from around 500 pre-fire to over 4,500 post-fire. Seeing that kind of shift confirmed just how dramatically these fires reshaped the landscape.

Python

Weather and climate risk in Python.

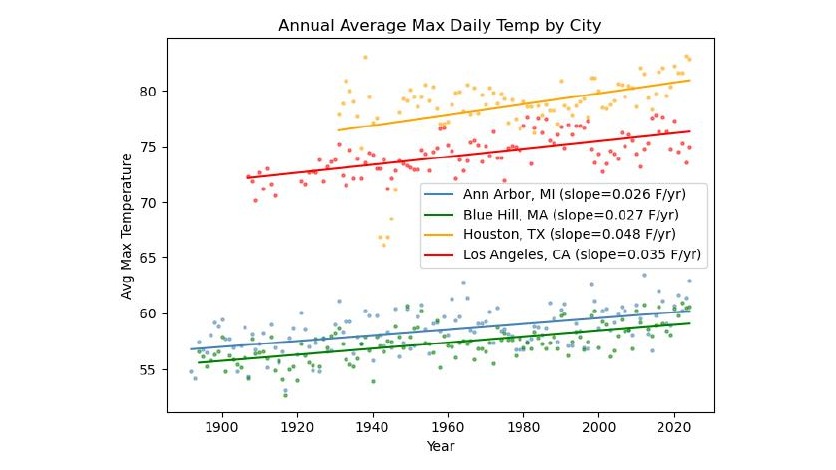
Chart of annual average max daily temperature by city

Meteorological Analysis

A century of NOAA data for four U.S. cities, processed with Pandas and Matplotlib: a single day showed nothing, but annual averages revealed a clear warming signal, fastest in Houston.

For this project, I pulled over a century of NOAA weather data for four U.S. cities (Ann Arbor, MI, Blue Hill, MA, Houston, TX, and Los Angeles, CA) and wrote a set of Python functions using Pandas and Matplotlib to load, process, and plot it. Looking at a single day (my birthday, December 13th) showed basically no trend, too much year-to-year noise. But once I averaged temperatures across the whole year, the warming signal became obvious and statistically significant everywhere I looked. Houston came out warming the fastest of the four cities, and each one had a completely different seasonal profile depending on its climate.